
Download a Psychrometric Chart From Parameter Generation & Control
Parameter Generation and Control now offers website visitors a free, downloadable PDF of the psychrometric chart. If carrying out heat load or cooling load calculations with a humidity control room or humidity chamber, turn to the psychrometric chart as an initial resource to understand the relationship between the different variables in air. For more information on our chamber and control room product and service offerings, contact us to request a quote today.
What Is a Psychrometric Chart?
A psychrometric chart represents the psychrometric properties of air. With this chart, engineers can better assess psychrometric processes and find practical solutions. While this chart looks complicated and even intimidating, it’s actually quite helpful and simple to understand once you grasp the basic properties of air. If you know two parameters of air where the lines will cross each other, the psychrometric chart can do the rest of the work for you.
The Benefits of Using a Psychrometric Chart Correctly
A psychrometric chart prevents engineers from spending time on tedious mathematical formulas. While there are online calculators and applications to help make calculations, using the chart correctly provides engineers with a more accurate reading as long as you know two parameters of air. Knowing how to read a psychrometric chart is a wise skill for engineers to have in the event that technology fails or isn’t available.
What Are the Parts of a Psychrometric Chart?
A psychrometric chart consists of eight standard parts, including:
- Temperatures
-
- Dry Bulb – This is the temperature reading found on a typical thermometer. You can find a psychrometric chart that offers these temperature ranges:
- Low temperatures that range from -20 degrees FDB to 50 degrees FDB
- Normal temperatures that range from 20 degrees FDB to 100 degrees FDB
- High temperatures that range from 60 degrees FDB to 250 degrees FDB
- Wet Bulb – This is a typical thermometer’s standard reading if the sensing bulb is covered with a wet wick or sock and exposed to air flow.
- Dew Point – At this temperature, moisture starts condensing from the air.
- Dry Bulb – This is the temperature reading found on a typical thermometer. You can find a psychrometric chart that offers these temperature ranges:
- Specific Volume & Density – Specific volume is measured in cubic feet per pound. This refers to the amount of space air occupies per pound of weight.
- Enthalpy – This is the measurement of heat energy. Enthalpy is measured by Btu (British thermal unit) per pound of dry air.
- Sensible Heat Ratio – This is the total sensible heat flow divided by the total heat flow.
- Sensible Heat Flow – 60(specific heat of air in Btu/lb ºF (0.24 at 72ºF))(density of air in lb/ft³)(air flow in ft³/min)(| supply air temperature – conditioned room temperature |)
- Latent Heat Flow – 60(latent heat of vaporization of water in Btu/lb (970 at sea level))(density of air in lb/ft³)(air flow in ft³/min)(humidity ratio difference in lb water/lb dry air)
- Moisture Content – Also known as the humidity ratio, this is the total weight of water vapor per pound of dry air.
- Relative Humidity – This refers to the percentage of water vapor per pound of dry air in relation to how much the air can hold at its current temperature.
- Vapor Pressure – Vapor pressure is measured in inches of mercury and represents the pressure exerted by water vapor in air.
- Standard Air Dot – This dot marks the measurement for standard air. Standard air is typically 70 degrees Fahrenheit with a relative humidity of 54% and 60 gr/lb of specific humidity.
Learn More About Our Humidity & Temperature Control Solutions!
Explore the capabilities of psychrometric charts with our advanced Environmental Chambers. These chambers are expertly crafted for dynamic temperature and humidity control, making them ideal for the precise simulations needed in your environmental studies.View Our Full Inventory of Humidity Control Rooms and Environmental Chambers
How to Read a Psychrometric Chart
A psychrometric chart can easily be read by following these steps:
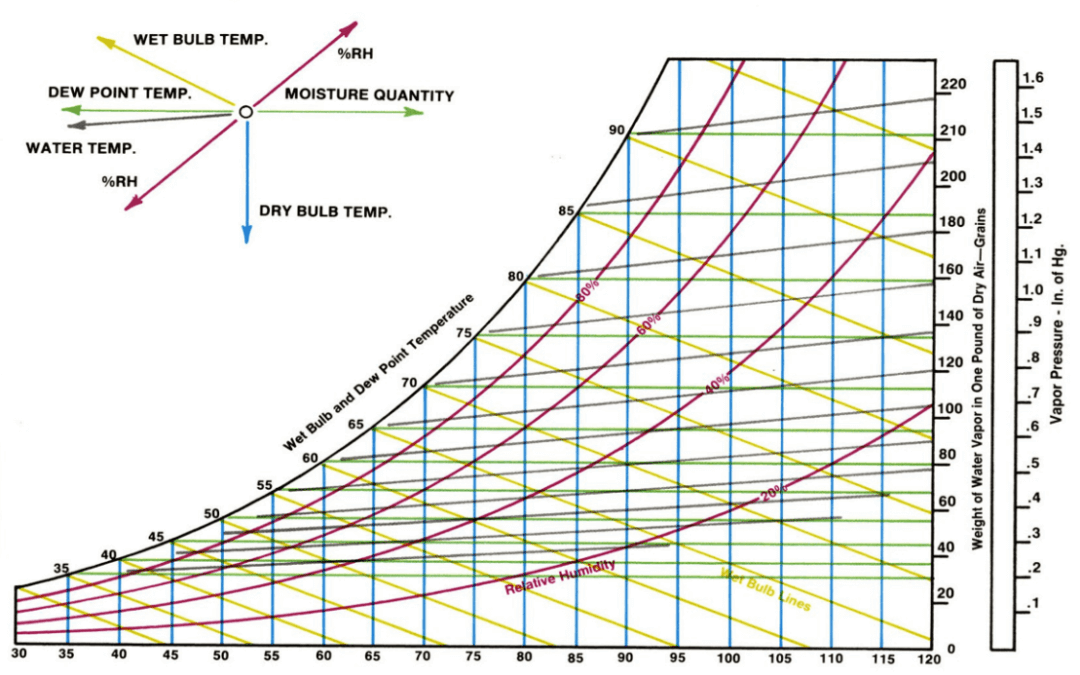
Step 1: Locate the dry bulb temperature. This will be measured in degrees Fahrenheit or Celsius and will be along the bottom axis. Also identify the vertical line for each temperature.
Step 2: Locate the humidity ratio, sometimes labeled as a mixing ratio. This will be along the right vertical axis. Humidity ratio units are grains of moisture per pound of dry air or grams of moisture per kilogram of dry air.
Step 3: Located the left-most curved line. This refers to the saturation curve where relative humidity is 100%.
Step 4: Locate the interior curved lines, which represent percentage levels of relativity humidity.
Step 5: Locate the dew point. This is a vertical line on the right side of the chart. These lines traverse the chart as horizontal lines.
Step 6: On the other side of the dew point’s vertical line is the vapor pressure scale. Vapor pressure lines also traverse the chart as horizontal lines.
Step 7: On all outer sides of the chart, you’ll see scales representing enthalpy. With a ruler, you can match the scales across the chart.
Step 8: Find the second set of diagonal lines which identify wet bulb temperature. Though these lines are close to the enthalpy lines, they’re not actually parallel.
When using Airtable’s PDF psychrometric chart, there are some formational aspects to be aware of. First, the properties of air indicated in the chart are calculated at standard atmospheric pressure. For other pressures, relevant corrections have to be applied.
Also note that the relative humidity lines are the curves extending from the lower left to the upper right portion of the chart. The relative humidity curves indicate different values of humidity measured in percentage. The value of relative humidity reduces from left to right.
For more industry recommendations and how-to guides, check out our other posts here.